lcodemaps
Literate Code Maps
Diagramming Methodology Specification - version 1.0 - Author: Andy Bulka
Literate Code Maps are diagrams which help programmers understand the structure and behaviour of source code. Based on, but more practical than UML.
Code Map diagrams differ from UML diagrams in that they focus on real source code fragments and lots of rich-text formatted story-telling narrative. They combine class and sequence diagrams into the same diagram, offering step by step numbering to follow the behaviour of a use case story.
Literate Code Maps - are not to be confused with the Code Map feature of Visual Studio Enterprise. Literate Code Maps are a free and open diagramming methodology. Visual Studio Code Maps is an interactive code relationship analysis tool reserved for Microsoft languages and customers.
The 5 laws of literate code mapping
- Boxes represent any scope or namespace - be creative
- Show structure and behaviour in the same diagram
- Code compartments in boxes contain code fragments and richly formatted narrative
- Lines representing function calls between boxes are numbered to tell a story
- Cross reference numbers can appear anywhere to associate ideas
Think of literate code maps like UML class diagrams where the classes are now boxes which can represent more things, and lines represent function calls as well as structure. Boxes contain one or more extra compartments containing real code fragments and rich narrative.
Quick Intro
The secret behind being Literate
Perhaps you have heard of the saying:
Homines dum docent discunt — Men learn while they teach. - Seneca
Literate Code Mapping is like teaching, mainly just to yourself. The act of drawing boxes with relationships and writing text explanations - to a decent level of literacy and professionalism will lead you to understand the code.
Similarly, if you are not dealing with code but dealing with another domain - the same principle applies. Writing a high quality article for oneself is like a literate code map, it clarifies and solves. Try it: When taking notes whilst learning a new area - instead of scrappy notes and jumping from thought to thought, try consolidating your notes into a coherent, literate blog post that flow logically. In the end you’ll have an artifact or even article that you can possibly share. More importantly, you will have understood the problem domain, and by re-reading your literate artifact, you will be able to rapidly refresh your memory at any time.
If the domain is not diagram worthy, bullet points and outlines are enough. Some domains don’t even need any structure like bullet points and plain text is enough - it’s a continuum of tools we employ when being literate.
The important thing is to be literate, which is the step by step thinking and exposition of a problem space to a quality level, which solves and explains the problem, for yourself and others.
So, when analysing a domain or code-base, don’t just rely on scrappy notes and jumping from thought to thought (in the case of code, jumping from file to file, trying to keep things in your head). That won’t guarantee a solution. Be literate!
Maximize data density
As Tuft says: “Visual representations of data must tell the truth… Above all else show data… Maximize data density”. For programmers, data means source code including variables, data structures, sample values and payloads.
The traditional UML class
becomes data rich and full of useful detail
A diagram need only list the code fragments that are required to tell a particular use case story.
Numbered steps
To avoid being lost in abstraction, Literate Code Maps rely on textual narrative and story telling, as well as numbered steps for the reader to follow. A diagram should have a starting point and a series of steps to follow, to tell a use case story:
Notice the box “H” which represents a HTML file - you see, boxes can represent any Namespace or Component - not just Classes, as we will see below.
Cross References
Use of cross reference numbers in the diagram handle the multi-dimensional relationships involved in thinking about and explaining software, and its cross cutting concerns.
Cross references are red numbers e.g. 22 or 23 with destinations as e.g. #22.
Lines between boxes are reserved for function calls.
Boxes represent any namespace
In Literate Code Maps diagrams, boxes can represent any Namespace/Component/File/Thing - not just Classes. Even files can be represented as boxes in the diagram. Code Map diagrams boxes can thus represent:
- classes
- packages
- functions
- namespaces
- files of any type e.g. HTML
- module files of Python/C/Go/etc
- sub-systems
- any architectural or deployment grouping
- etc.
Code Map diagrams boxes are not tied to Object Oriented paradigms, and are thus more universal and useful.
Instead of using square boxes, you might want to use different shapes e.g. https://blog.anoff.io/puml-cheatsheet.pdf shows all the component types you can use.
It is recommended that boxes have a “stereotype” indicating what kind of box it is. For example for a Python module is stamped with an “M” which stands for module. To be explicit and less mysterious, we can also spell out the word “MODULE” and the path to the file in the diagram box. For HTML files the icon stereotype should be “H” with the word “HTML FILE” and the path to the file etc.
HTML files as Boxes
HTML files with fragments of HTML markup can be represented - great for showing how code interacts with HTML templating.
Javascript code fragments residing in the HTML file can be represented - see above diagram.
Files of functions as Boxes (no classes)
Files containing just functions and variables (no classes) can be represented as boxes in a way that makes them “look like” classes. For example, the Python file “utils.py”
x = 1
y = 2
def fred():
    pass
turns into
which looks like a class, even though there is not a class in sight!
Thus, Python programmers with modules (files) containing only variables and functions will be able to visualise their codebase. The online diagramming tool GitUML already supports reverse engineering Python modules into boxes in this way. This representational idea is also a boon for Javascript programmers who may have lots of variables and functions, and no classes. Together with the ability to visualise HTML files as boxes, web developers now have the ability to model aspects of their projects. Languages that may have files containing only functions include Python, Javascript, Kotlin, Delphi/Object Pascal, Go, C and many others. Regardless of the language and box type, ideally, the traditional data / behaviour separation in boxes should be followed.
Examples
Here are some more examples of literate code maps.

More Complex Example

Event Flow (Literate Code Map Diagram)
Here is an example of a Code Map of the event flow of a small application (my TodoMVC-OO implementation in Javascript using traditional OO and Controllers instead of fancy Javascript frameworks). Events are reified as coloured objects, each different event gets a different colour.
Note: The eventing pattern depicted here is Publisher-Subscriber where real event objects are ‘broadcast’ into the ether/event bus/system/whatever - allowing any code in the system to subscribe and respond - the point is, the code emitting the event does not have references to receiver object/methods. This eventing approach is more flexible and powerful than the Observer pattern since the Observer pattern requires observers to know about and subscribe to Subject objects, which is not always possible or convenient. More dicussion on the differences can be found in this article and on Stackoverflow.
I used to be a fan of the traditional Observer pattern but in my later years find the Publisher-Subscriber pattern to be simpler and more powerful - plus Publisher-Subscriber is built into Javascript you simply
document.addEventListener("hello", (event) => { ... })to listen anddocument.dispatchEvent(new CustomEvent(event_name, { detail: {from: from, data: data } }))to notify all.
Notice in the following code map diagram the:
- use of colour on the dotted lines (representing events being triggered and received)
- use of corresponding colour on the event
- use of corresponding colour of the code fragments
 (click on diagram for more detail and the ability to zoom)
Building your own Literate Code Maps
By building a Literate Code Map of a particular use case story in your code base, you will end up understanding the source code - and be able to effectively fix a bug or add a feature. As a bonus, you can refer to your code map in the future, and share it with colleagues.
Think of building a Literate Code Map as the process of “taking notes” as you study code - something that most programmers aleady do. The benefit of a code map is that the diagram auto-lays out as it grows and changes, always looking good. Plus by following the 5 laws of literate code mapping, you have a simple methodology to follow rather than unstructured and undisciplined personal notes that cannot be shared and will likely end up in the bin.
It is recommended to use PlantUML markup to generate your Literate Code Map diagrams. GitUML supports building Literate Code Map diagrams online with a built in PlantUML editor plus useful PlantUML snippets that support Literate Code Mapping e.g. adding a “code compartment” or cross reference.
To create code compartment in boxes/classes, use the following markdown sytax e.g.:
.. def myfunction(param1, param2): ..
For each box, first list attributes and methods in the traditional UML way, with a dividing line between them - let’s call this the summary view. Then append extra compartments within the box for each method we are interested in expanding upon with code detail and text narrative. Any methods which are expanded, should be bolded in the UML summary view of methods, so that the reader knows there is more detail below.
When using PlantUML to build Literate Code Maps, it is useful to know that you can define a class multiple times and PlantUML will combine all the definitions into the one box. In this way you can incrementally build up the diagram. You could create one piece of PlantUML to define the summary view, then another piece of PlantUML to create the additional code detail compartments.
class Shape {
    canvas
    parent
    --
    <b>SetCanvas()</b>
    <b>GetParent()</b>
    SetBrush()
}

class Shape {
    .. SetCanvas() ..
    Narrative rich text comments and code about this method here.

    .. GetParent() ..
    Narrative rich text comments and code about this method here.
    $code ...
}
Source Code fragments
To include source code fragments inside the “code compartments” of boxes, define this handy macro at the top of your PlantUML e.g.:
!$code = "<color:royalBlue><size:14>"
then simply add the word code before each line of your code fragment. Use spaces to indent, or \t.
$code for i in range(100):
$code     print(i)
Tip: By using GitUML to build code maps, you can use simply surround source code fragments with the usual ``` syntax - which is much easier than prepending
$codebefore each source code line.
View the examples directory for the full source code to the code maps used in this article.
Tools to build code maps
GitUML supports building UML and Literate Code Map diagrams online, using a combination of source code reverse engineering and PlantUML markup.
 2 minute video tutorial
Zoom
Literate Code Maps are ideally generated as .svg files so that users can zoom in to view more detail and there is never any loss of important detail. All the diagrams in this article are SVG and can be clicked on and zoomed into.
Diagram Size
The public PlantUML server used to render some of these code maps has a limit on the size of the diagrams it produces. You can easily set up your own PlantUML server locally which not only is faster, but can generate much larger diagrams before clipping them. See the PlantUML Server Documentation. See also the helpfile in Pynsource (Python UML tool for Mac, Windows, Linux) as it contains more specific PlantUML server local install instructions.
History - Why Code Maps?
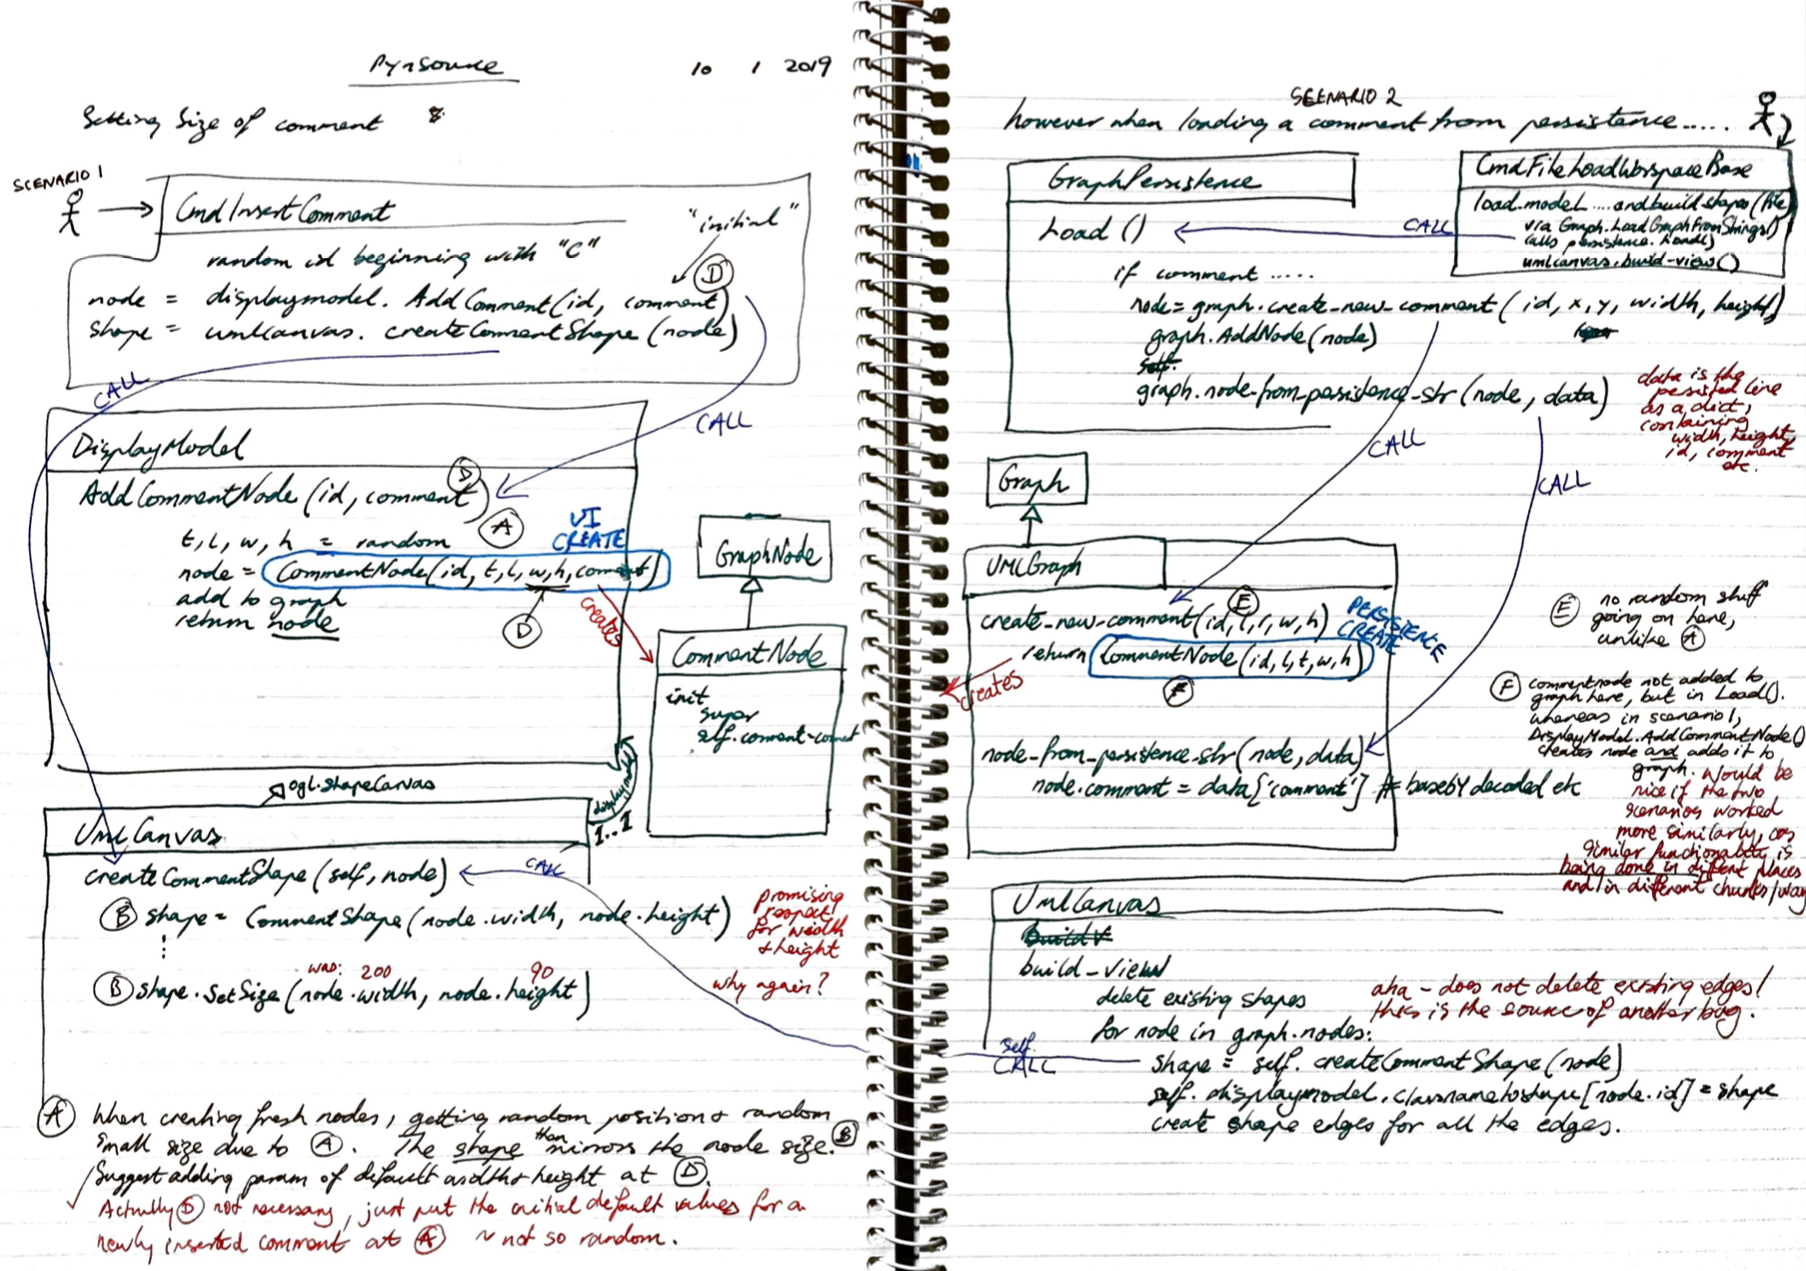
Whenever I have encountered a huge codebase, or an old project I wrote myself, or just a complex code area - I typically trace out and make notes as I read the code. How many programmers do something similar? Here is an example of a hand-crafted literate code map:
Evolution - stage 1
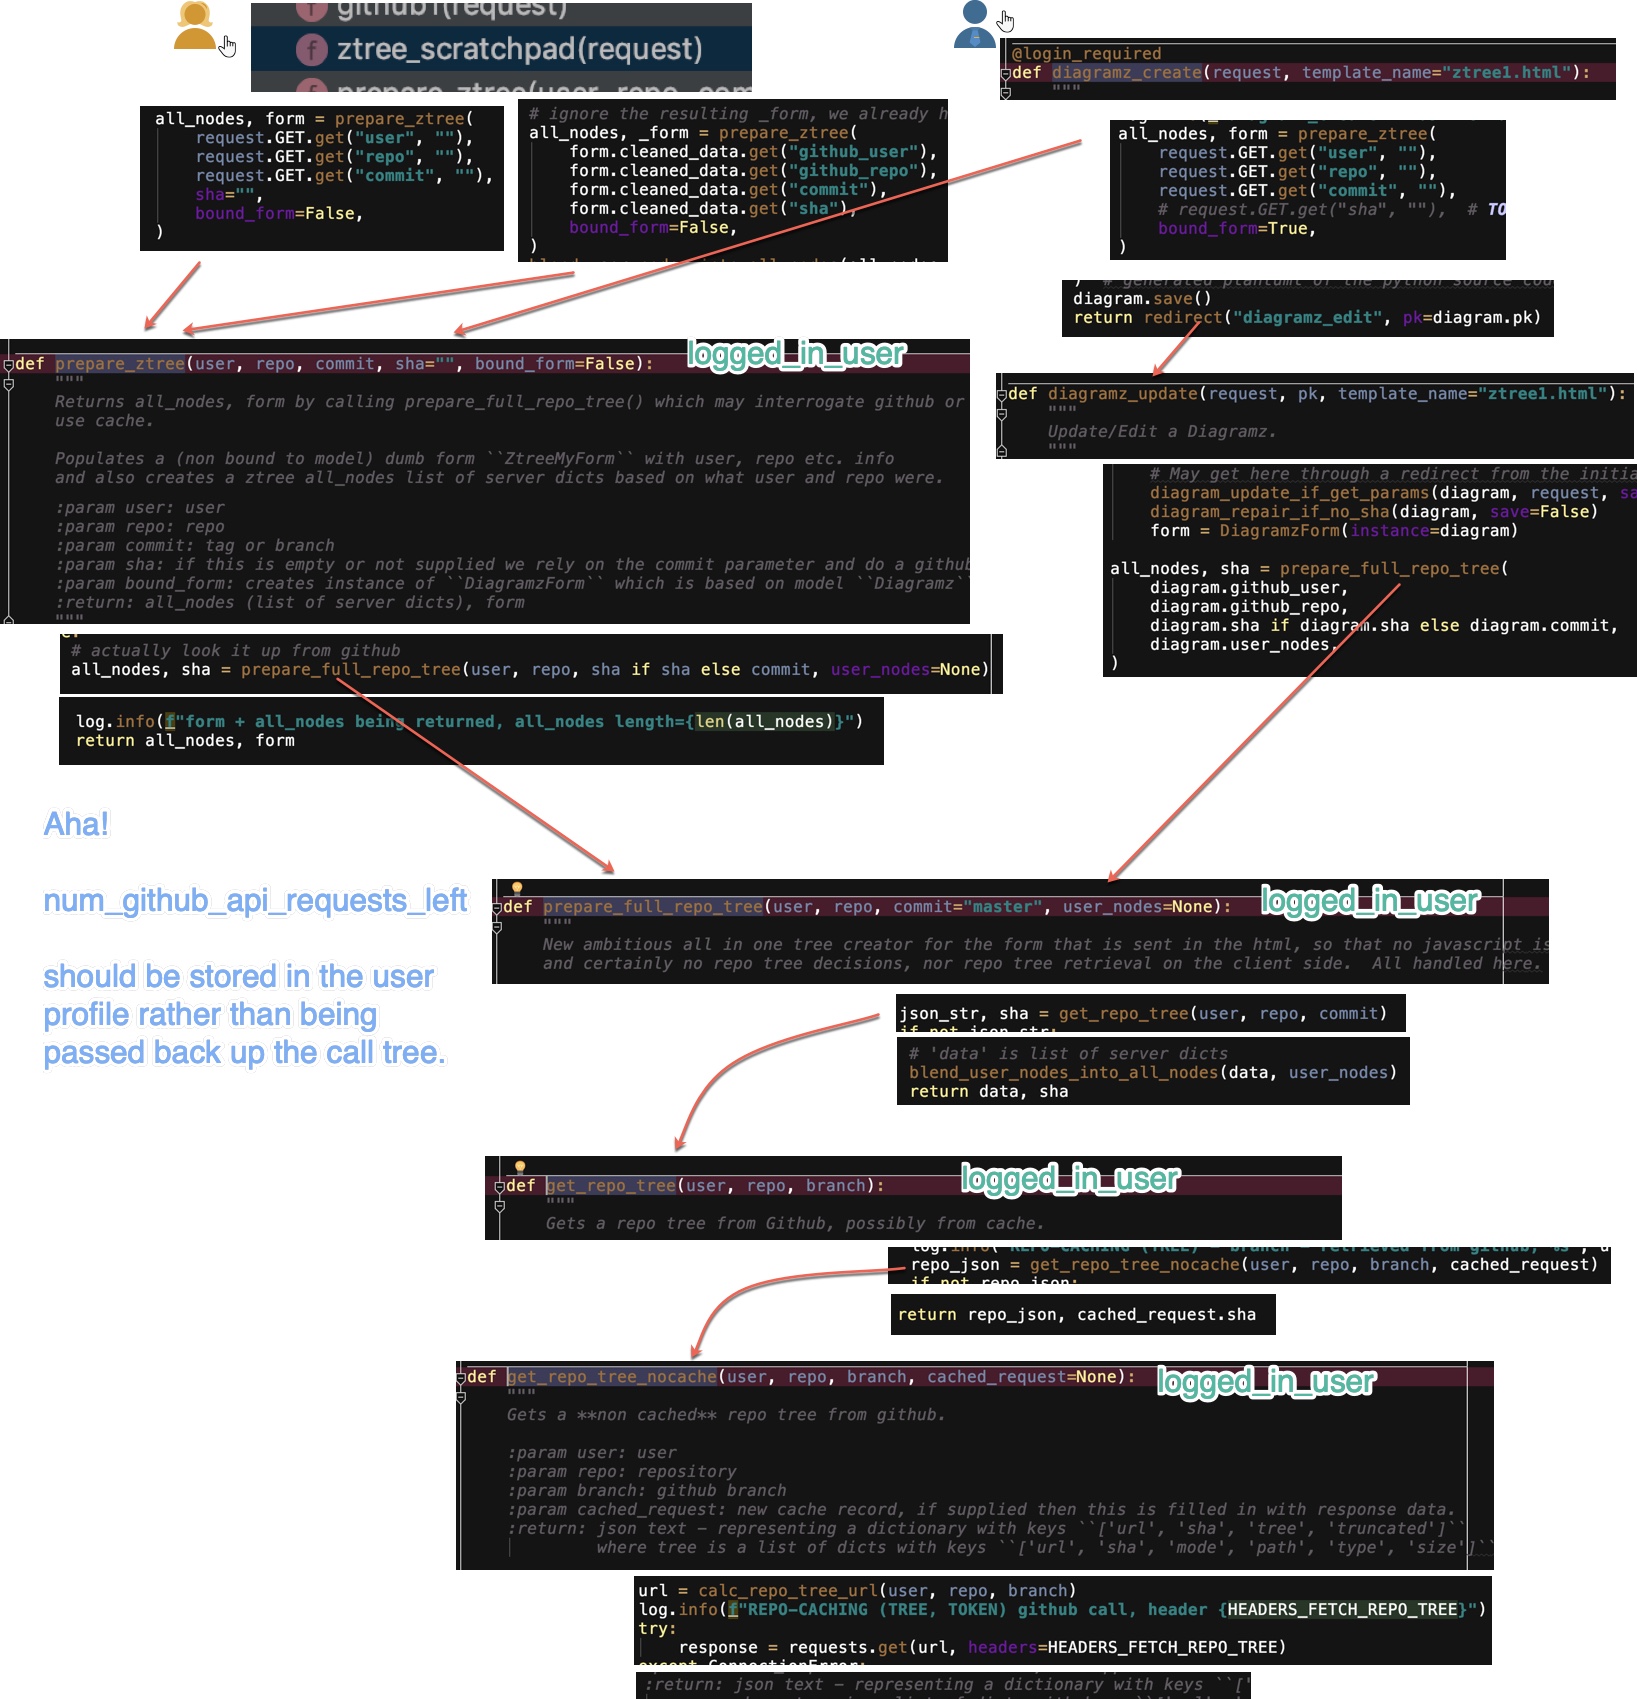
Over the years, this became a useful and effective habit: when stuck, take a breath, respect the difficulty of the situation and - build a literate code map. Eventually I started copying and pasting code fragment screenshots into a paint tool - why re-write when you can copy and paste! I connected the boxes with lines and added use usual narrative text comments. This was a little more professional, but gee - I wish I had auto-layout so that I could squeeze and rearrange the diagram when I discovered new things. Here is an example of an old hand built ‘digital’ literate code map diagram:
Evolution - stage 2
Finally I moved on to using PlantUML markup code - allowing the diagrams and notes to be automatically laid out, be pretty to look at and maintainable.
Evolution - stage 3
The above diagram was created in GitUML which supports building Literate Code Map diagrams online with a built in PlantUML editor plus useful PlantUML snippets that support Literate Code Mapping e.g. adding a “code compartment” or cross reference.
This is still “state of the art” in terms of convenience and automatic layout etc, despite my thoughts below on the evolution of Literate Code Mapping stage 4. But if you want a really handcrafted, super-precise diagram with close links to your source code and use the vscode editor, read on!
Evolution - stage 4 (2021)
In June 2021 I discovered that the free diagramming tool draw.io had an extension for Vscode, which allowed you to draw diagrams without leaving vscode. So for fun I manually built a literate code map of some code I was working on - all handcrafted with copy and paste etc. By breaking up the diagram into smaller pieces (viz. ensure a function call source line or a method definition source line is its own text object in draw.io), I was able to get arrow ‘calls’ from and to the actual line of source code that I wanted - very precise.
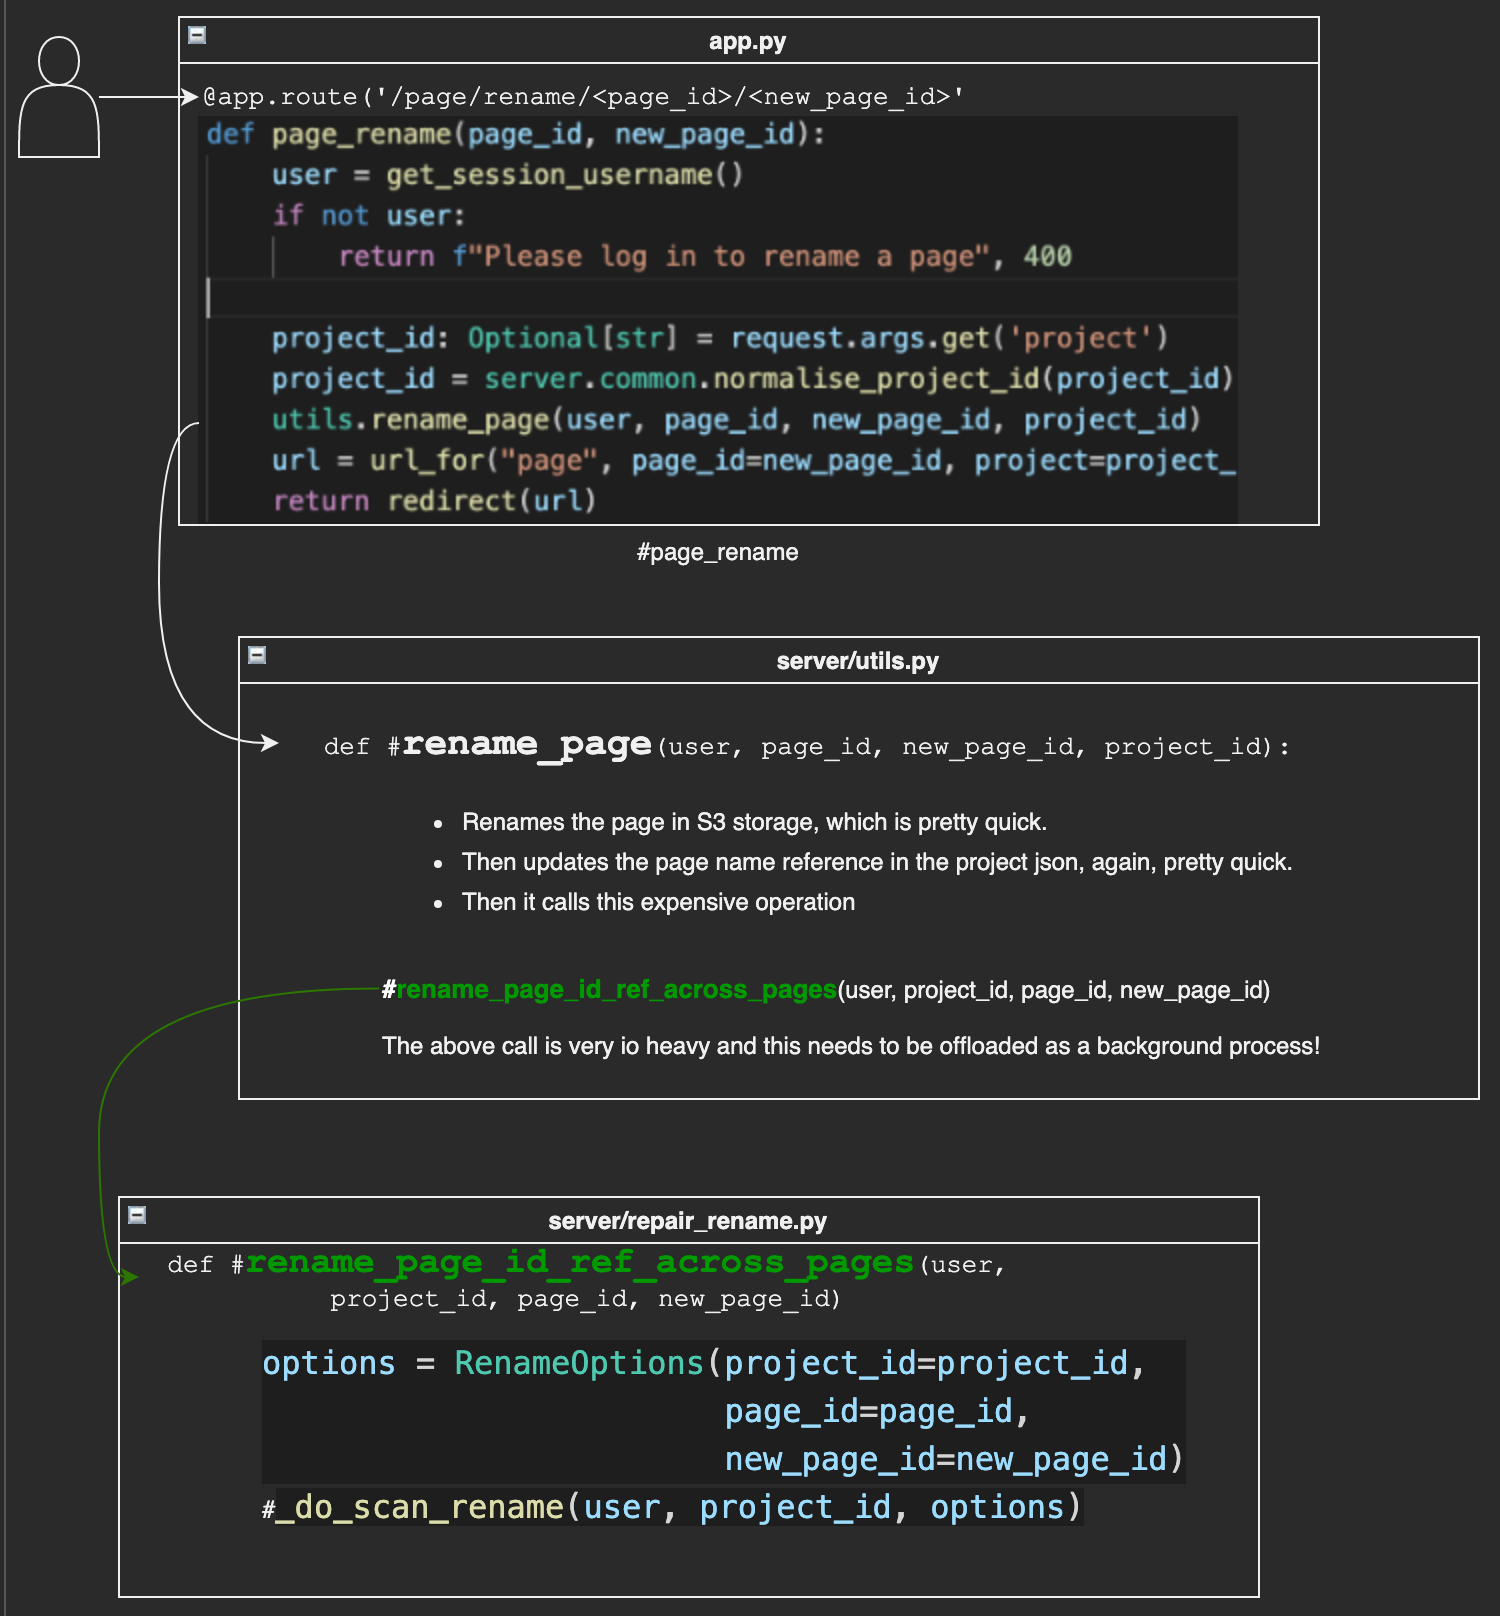 Demonstrates a literate code map built in draw.io
In this diagram source code areas (a key feature of literate code mapping) are attempted as both a screen shot (faster to make) and also as copy pasted text (had to correct indenting after paste).
Draw.io has
- lots of formatting (text, colour etc) choices for my diagramming.
- the ability to collapse and expand diagram areas - very handy when building large diagrams - there is a layout feature too.
- custom template shapes - I’m thinking about building a set to help hand craft literate code maps using draw.io.
- an ability to liveshare to present or edit diagrams collaboratively
- the ability to paste screenshots into a diagram - I used this to screen shot some code rather futzing with copy paste of text and correcting and indenting the resulting diagram text box - it was faster.
- the ability to link a screenshot or a text box node of e.g. a react component “MyComponent” with its source by naming the node “#MyComponent”?
This last feature (the ‘code linking’ feature of draw.io) is possibly the coolest - whereby adding #symbolname text to any diagram object auto navigates to the source code of that symbol when you double clicked it (make sure drawio code linking is toggled on in the bottom status bar). This means that I can jump from the diagram to the source code with a double click - very powerful.
 Demonstrates a literate code map built in draw.io, double clicking on diagram areas to jump to associated source code & collapsing diagram areas.
- View raw gif literate-drawio-vscode-01 gif.
- Download the above renaming.drawio diagram file.
Further thoughts on draw.io
Whilst this ‘stage 4’ evolution of Literate Code Mapping is not as automated and rapid as that supported by GitUML, it does show how a rich diagramming tool could take literate code mapping to another level - esp. with with source code linking and collaboration features.
The draw.io approach to building literate code maps is currently relatively slow and tedious, very hand crafted, very ‘literate’ in the sense that you have lots more control to be as non-UML as you like. To mitigate this with some automation, I’m thinking that a Literate Code Mapping Vscode extension could perhaps be built to communicate with the draw.io diagram to automatically parse code, build UML style objects and embed literate code mapping areas automatically, from selected code fragments.
Tufte
Whilst I knew my literate code maps worked (for me, personally) - I didn’t have any research or scientific backing for them.
Then I thought of Edward Tuft’s visualisation work, which I have been a fan of for a long time. Sure enough, his ideas on density, detail, rich formatting, use of icons and small graphics at any place where you would put text - are all consistent with literate code maps. Especially the idea of combining detail and abstraction in the same diagram - the boxes are the abstraction and the code is the detail.
I hope to tie more of Tufte’s insights into the Literate Code Map methodology, as well as draw from the vast field of Information Visualization.
Wikipedia says “Information visualization presumes that “visual representations and interaction techniques take advantage of the human eye’s broad bandwidth pathway into the mind to allow users to see, explore, and understand large amounts of information at once. Information visualization focused on the creation of approaches for conveying abstract information in intuitive ways.
I also like many of the ideas of C4 architecture notation e.g. each line being labelled and having a direction. C4 also has some good criticisms of UML in the main C4 video, which I encourage people to watch.
UML
Literate Code Maps are not UML.
Code Maps are more detailed and can actually be used to debug code and add features, because they contain code fragments which are relevant to day to day programmers. They contain narrative, story telling text - which leverages how we learn. They also take advantage of the human eye’s broad bandwidth pathway to take in visual information.
UML is useful when judiciously used, but most UML diagrams tend to be too abstract to actually be helpful to a programmer. As I write in my blog,
UML (Unified Modelling Language) has fallen out of favour in the last decade and now tends to only get used in the most basic of ways. Sketches on whiteboards to commuicate class relationships or code execution sequences. Or simple diagrams in documentation and designs. Nobody uses the complex notations of UML 2, because digramming cannot keep up with the myriad programming techniques and paradigms of 2018 - code is simply not reducible to visual information.
I think that there are a limited numbers of cases where UML diagrams might be helpful:
- whiteboard communication
- database modelling
- reverse engineering existing projects to understand them (see GitUML)
- big picture architecture diagrams (also see C4 architecture notation)
- class diagrams of complex class relationships
- representing design patterns
- sequence diagrams of certain code behaviours
- state diagrams are also sometimes useful
UML usually lacks normal human, tutorial-like, step by step narrative textual storytelling and code level detail. Staring at at a UML diagram typically leaves you wanting much more detailed information. Staring at source code typically leaves you wanting a diagram of relationships and context. Literate Code Maps are an attempt to solve this problem.
Contributing
If you wish to contribute to this diagramming specification I am open to pull requests via the project’s dedicated Github Repository.
Let’s make Literate Code Mapping a practical, useful visualisation technology that can, on ocassion, help software development - without the old UML preconceptions and baggage.
Resources
- Literate Code Maps Documentation Home Page.
- Literate Code Maps Github Repository