Visualising Software
Ways of Visualising Software Designs
This blog article explores the novel ways of developing software more visually and in visualising software generally - that is without coding. It also explores ways of visualising software designs and of watching software execute. Visual Programming and Executable UML are the closest terms that describe this area.
Some of these projects have failed and others continue to thrive (e.g. Scratch). As of 2020 the new big thing in this area is low code and no-code.
Introduction
Creating software in a visual way would arguably lift the level of abstraction in how we create software. Is it even possible?
Model Driven Design
Whether its MDA (model driven architecture) with UML or Case tools from the past - this has clearly been a dream for a long time. Martin Fowler considers the viability of MSA in an interesting blog entry - also providing links to other peoples’ opinions in this area.
For example there are some that argue UML (even the latest 2.0 version) is not computationally complete, or that programming visually is not all that its cracked up to be and and may not be as efficient as textual coding techniques. Here is yet another critique of UML as a modelling tool good enough to generate code. These sorts of critiques certainly don’t stop the vendors - there are a lot of MDA tools e.g. [here is a list](#Links to MDA tools).
Case Tools
I’m an optimist and part of me wants to see some sort of MDA / Executable UML approach work. However it may not look like existing solutions - we need to look outside the box and find a blend of metaphors that are trully innovative. That’s why this page exists - lets explore what programming visually looks like.
OO as Biological Cells
I once came up with the idea of OO programming being like a “world of cells”.
The most complex systems on earth, including the human body, are composed of biological cells amongst other things. Shouldn’t we be looking to biology for metaphors for programming?
Here is a thought experiment for you. Imagine running software as a collection of biological cells, each cell representing an instance of a class. Each object / cell lives in a community of objects, sending messages to other objects, storing data and providing behaviour exposed as methods. It might look something like this:
OO software as biological cells?
Like in UML, the top half of the cells are storage (primitive data including pointers to other cells) and the bottom half represents the available public methods of the object.
The red lighting symbol next to a method name represents a method being invoked.
Imagine being able to pan around and view different aspects of this running software model. The technique used by the information organiser the brain might be one cool way to browsing, navigate and perhaps organise such “computational space”.
Executable UML
There are only a couple of high end tools that get into the territory of being able to draw UML diagrams and generate code - which is executable. The idea is that it saves implementation time and round trip engineering where you suck the implementation back into a UML model and to and fro and to and fro with all the synchronisation nightmares that entails.
UML is not expressive enough to cover all that code needs to do, so some of these tools come with a language that you have to use anyway.
There are a couple of books in this area. One is called Model Driven Architecture with Executable UML which is linked to the Keneddy Carter tool (see below) and the other is called Executable UML: A Foundation for Model-Driven Architecture which illustrates its examples using the BridgePoint tool.
The software tools I have found are
- BridgePoint tool suite from Project Technology.
- iUML Modeller and Simulator from Kennedy Carter
- Rhapsody by IBM (formerly by ILogix Telelogic)
The great thing about some of these tools is that you can in some cases actually watch your UML execute -they call it “executable UML-based application development”.
I’m about to run the latest trials of these products. I’d be interested to see how they handle sequence diagrams, since sequence diagrams are not syntactically expressive enough to precisely model for loops and if statements to a practical, executable level. In UML you can use OCL (object constraint language) and a few UML indicators to indicate looping etc. but to cover all the coding possibilities you need more.
Simpler Approaches
Executable UML is currently not for the faint of heart - its pretty complicated stuff but I hope that will change. For a simplified programming environment check out Scratch
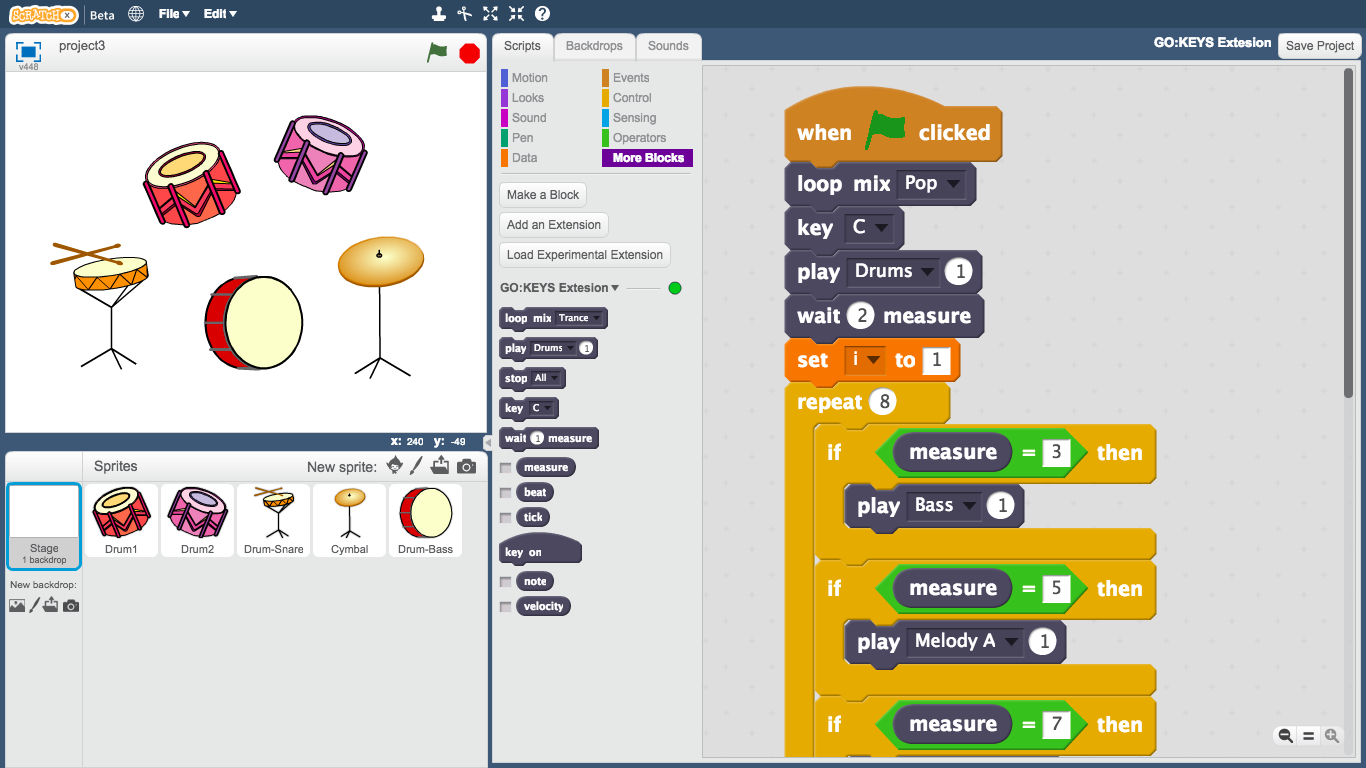
Scratch - programming for students
With Scratch you can drag and drop your coding fragments, no typing. Its truly amazing and whicls tit caters to kids, I really wish they would expose an object oriented, serious version. In the current version you can define objects and broadcast and respond to messages, so its no slouch in the OO stakes, however you need to be able to define classes and instantiate them - at the moment you cannot instantiate arbitrary ‘sprites’ easily.
Apple’s automator is a visual programming system for intra-application workflow. It comes bundled with all Mac’s, though in order to automate MS Office you need to buy the business version not the home edition.
Apple’s Automator - for workflow
The Wiring Paradigm
Another interesting system is Synopsis which lets you wire together your entire program without writing code. You can drag and drop if statements and plus everything together. You can group components and subsume them into a sub component - which reduces clutter and helps organise your work.

The Synopsis application development environment - no text coding!
Trying it out I found it fascinating, though it sorely needs the more sophisticated thumbnail bread trail that SynthMaker (see below) has. The wires are auto routed (thankfully) but things get pretty messy quickly. I found that there was not enough information visible on the components themselves to figure out what was going on - you keep having to hover over components or double clicking on them to investigate the deeper logic. Finally it gets quite tiresome doing if-then logic using wires. I suspect that a touch of the Scratch metaphor (see above) would be better for those sorts of tasks, within a larger system of wiring. A mixed metaphor approach? Anyway, a brave effort.
Another similar effort along the same lines (plug together syntax with wiring) is ViPEr: a visual programming environment for Python, which “allows non-programmers to interactively build networks describing novel combinations of computational methods, and yielding new visualizations of their data without actually writing code”. It seems to be part of something called MGLTools now - here is a screenshot:
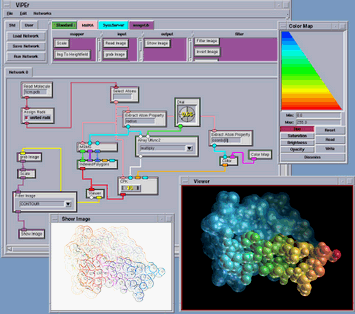
ViPEr - visual programming for visualisation research.
The music software industry (synthesizer plugins, audo processing, music making) is light years ahead when it comes to visual interfaces. And in terms of programming visually, SynthMaker is state of the art, especially with regards to making the wiring more friendly and usable.
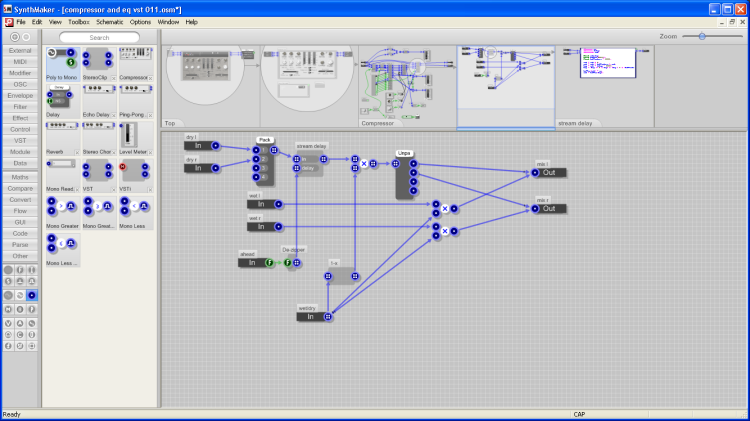
SynthEdit- synthesizer maker
SynthMaker allows you to program without writing code, linking together components. Interstingly you can drill inside components - worlds within worlds, and a “breadcrumb” screenshot panel at the top of the interface helps to give you a sense of where you have been and where you are now. Clicking on a screenshot takes you back to the component/world. This product is not just theoretical or academic - people make real synthesisers with this tool and even sell them commercially.
Build your own Visual Language
An interesting effort to build a compiler “compiler” for visual languages is CoCoViLa. Here you can draw shapes on a wrokspace to define the elements of your visual language. You define ports for how these elements connect to each other using wires. You can add java code to define what actually gets done when your shapes are connected to each other. For example you could define an “ADD” shape with two inputs and one output and then feed a pair of numbers into it to get an output. Connecting the output into the input of another shape would similarly chain on extra computation steps. The beauty here is that you can define your own shapes and logic. This is a phd project but hopefully will grow into something bigger and better, like an open source MetaCase. Here is an example of one of the “domain languages” that comes as an example:

CoCoViLa - define your own shapes and how they join together.
Debuggers as visualisers
Of course debuggers are the most obvious tools we have today for watching software execute. We can watch variables and see the current execution point etc.
There is a java visualisation debugger that is amazing when watching multiple threads.
The python for windows debugger is pretty amazing too. You can drill inside namespaces, objects and classes ad-infinitum. Even methods are objects, which have properties. Its not animation but its an interesting hierarchical visualisation of computational space and name space. P.S. What sort of interesting “spaces” are there in software? The Jbuilder 2 Bible by Armstrong has some fantastic descriptions of how software and objects operate and interact.
Visualisations using gui components
In my old Multimedia Toolbook programming days, if I was prototyping an application and I needed a datastructure to hold a list of strings, and if that data was something I might want to watch change during program execution then I would use a visual GUI component to hold that data. This way I could always ‘see the data’ and watch it change. After development I simple made the GUI elements (that would make no sense to the user) invisible but still operational.
Normally a programmer would choose a non visual datastructure, which would of course be many times more efficient than storing the data in a GUI component. It is also considered bad practice to couple your ‘model’ with GUI. However for prototyping, the advantages are instant and often beautiful visualisations, since you can also change the fonts, colors and placement of such GUI elements to produce pleasing visualisation layouts.
Note: this technique of using gui components as data structures is just a thought provoking idea of how to achieve visualisation of program innards and program behaviour. I am not advocating that you build your serious programs in this way.
Static representaion of “wiring”
I always liked the idea of Visual Age for Java technology. You draw links between components, both visual and non visual.

Visual Age for Java - radical ideas, but now discontinued.
UML lets you visualise classes etc. but doesn’t cover this sort of ‘real world’ representation of the wiring between GUI components on a form and objects in your model/application.
Visual Age style programming
I’m not sure why Visual Age was discontinued in favour of the more traditional Eclipse tool. Perhaps in use it was too cumbersome, or perhaps the particular implementation too complex? Or is the whole idea of visual programming too radical for popular acceptance?
Another slightly radical tool for representing hitherto ‘hidden’ and unvisualised information visually is the Delphi 6 data diagram and form diagrams. Both data diagrams and form designer have an extra tab, which lets you view your components schematically and see the wiring between them.
Delphi - form diagram - shows the connections between visual components.
Delphi - data diagram - shows the connections between database and visual components.
Note that Delphi (and most IDE’s) has always let you “wire” components together by setting a property on a component, with appropriate hinting in drop down combos - you select an object from a combo box in order to make the wiring (ie. set the property) - the combobox for each property lists all the valid components on the enclosing form that the property could possibly point / be wired to. To make these wiring connections with visual lines rather than combo boxes I guess is just another metaphor.
Software Visualisation
There seems to be some serious work being done in this field. Check out Software Visualization in Prolog by Calum A. McK. Grant (as a Dissertation submitted for the degree of Doctor of Philosophy) which has astonishing pictures of software visualisation tools and visual programming systems e.g.
The quicksort algorithm written in ProGraph.
Also check out Vmax http://www.cl.cam.ac.uk/Research/Rainbow/vmax/sshot.html
Vmax is a programmer’s text editor combined with a graphical browsing window for powerful visualization of source code and run-time behaviour e.g.
Another interesting tool I recently found was Jeliot 3 which plays an animation of your java source code executing. Its quite amazing, though there are limitations on what you can feed it (all classes must be in the same source file etc.). Here is a screenshot:
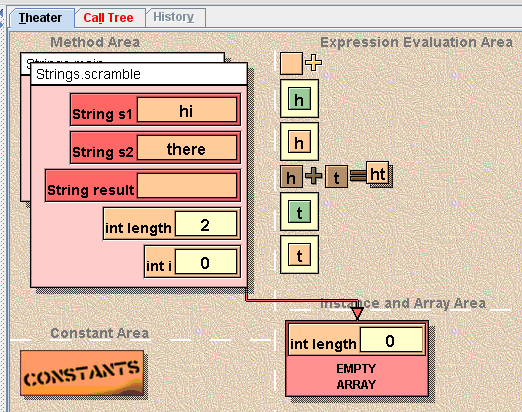
Jeliot 3: This was a screenshot I took during the animated playback of some java code
Code Bubbles and Spatial Development Environments
As of 2010 you’d think we had come a long way in terms of the visualising of software. And I think we have. I’ve just learned about Code Bubbles, a way of exploring code which displays relevant methods (of source code) in coloured bubbles, which you can glue together with other bubbles, to form islands of code that is related. Lines show what is expanded from what. Search functions let you fill bubbles with search results. Watching the video is the best way to get the idea. Old paper here.
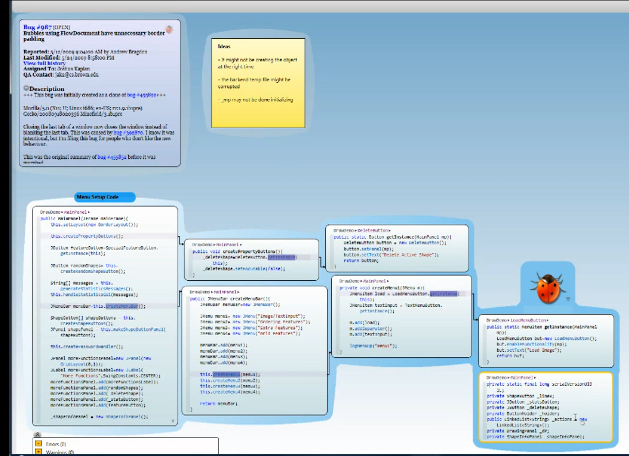
Code Bubbles Java IDE and Explorer
You can make memo notes, edit code, add icons (like the bug symbol). You can zoom out. Even more amazing, you can run debug sessions and create bubbles of methods as you execute code - so that you can see the trail of execution. A bubble can contain variables - or the state of the program at that point. All this is persisted in your bubbles diagram, for comparison purposes or later reference.
Lastly, you have a huge workspace to play with. Notice the bar along the top of the screen in the following screenshot:
Code Bubbles Java IDE and Explorer
The bar along the top is a high level minimap running horizontally. Clicking on this minimap area scrolls the main workspace to show those bubbles. Ableton Live and many DAW (Digital Audio Workstation) apps have such horizontal minimaps. It also reminds me a little of SynthMaker (see above, near the start of this article) where you get thumbnail representations of a more complex workspace. What is interesting with Code Bubbles is that you can drag out the minimap area to mark a region, and label it.
Code Bubbles seems to visualise what goes on in my mind when I code - I deal with a collection of related code and code fragments - or a path of execution through specific code fragments / methods. Code Bubbles respects what is going on in my mind. Instead of bookmarking, switching tabs, scrolling constantly - Code Bubbles chunks together all related code fragments into the one place. This is truly a breakthrough and I can’t wait to try out the beta.
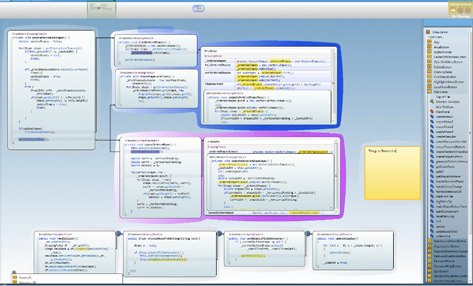
Another related tool comes from Microsoft Research, its called Code Canvas which is
an experimental research platform for building a spatial development environment. It lets us explore design alternatives when dealing with source code on an infinitely scalable two-dimensional surface.
Basically you get a high level view of the files in a project and as you zoom in you start seeing class and method names, and you can keep zooming until you see actual code - which you can edit in situ. Relationships like inheritance and references (e.g. who is calling a particular method) are indicated with appropriate lines. Its a nice experiment. It doesn’t chunk the information like Code Bubbles does, but does provide infinite zooming - from super high level where you even see apps and packages right down to code level.
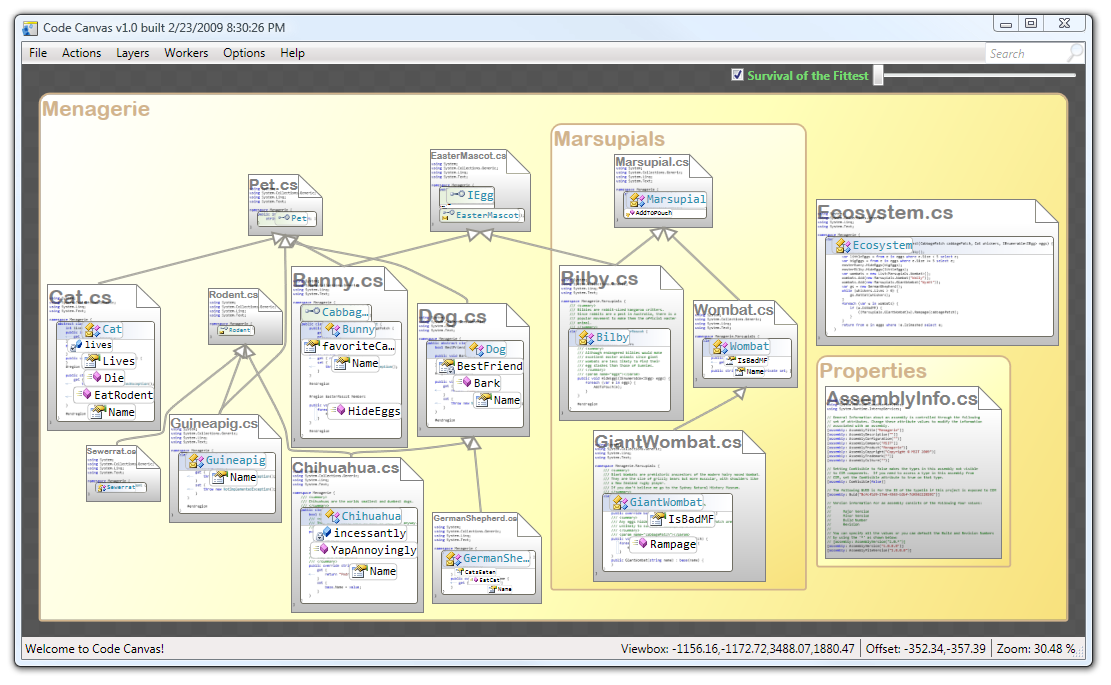 Code Canvas, from Microsoft Research
Summary
Ideally I would like to see approaches like Executable UML simplified down and incorporate the simple coding ideas of Scratch, albiet taken to a serious object oriented level (Scratch is really for kids at the moment). Design Pattern support would also be woven in - e.g. Netbeans 6 has a visual way of creating design patterns - see my Feb 2009 blog post on this. The visual form designing capabilities of Visual Age (now defunct, unfortunately) and Delphi form diagrams would complete are new lego was of building software. Of course case tools have always been around and to some extent people have become a bit cynical about them over the decades as no breakthrough application has ever appeared. We should still keep trying though as I can see progress on many fronts and can see all the wonderful pieces of the puzzle - they just need to be unified into a single compelling open source product.
My personal vision
My own vision is of a UML tool which doesn’t adhere strictly to UML in its committe born detail but takes a few risks (e.g. the way Visual Studio UML tool does) in order to innovate. You type code into the UML tool itself, without opening a window - its all right there on the workspace. Enterprise Architect displays code inside UML diagrams, so you can get a taste of how this might look. The potential clutter of code and UML in the one diagram would be alleviated by collapsable regions so that with all methods collapsed, all you see is a regular UML diagram with just methods listed.
And when I say type, I mean use Scratch type drag and drop to assemble code. You apply design patterns like in Netbeans and IBM Rational, and you can specify design pattern roles not only to the level of granularity of classes and methods but also to the level of code lines - that’s why its important to model and reify code lines into objects, so that they are more easily referred to by “active” design patterns (like in ModelMaker).
The design patterns themselves would operate at the level of classes, as is normal. There would also be dozens of language idiom patterns to assist with coding - e.g. iterating through a list is a pattern. Lets treat language idiom patterns the same way as we do design patterns at a class level - all in the same interface. Both class design and language coding becomes the same thing - pattern based lego.
You should be able to easily group UML objects into components which are like symbols in Flash. You can then define the connection types and plug them together. If you can’t plug them together directly then you might be able to drop in various adapters to help. We might be using protocols similar to the way genes and enzymes talk to each other. Speaking of grouping, you should be able to group components and subsume them into sub modules, hiding away all the detail. Then you double click to drill into that module - leaving a SynthMaker style breadscrumb of screenshots to help tell you where you are and where you have come from, and help you get back (just click on a relevant screenshot).
Method calls would be made using messages. Messages are a more powerful metaphor for talking between objects - you can send messages to specific objects like a normal method call but also broadcasting messages broadly - there are are even books on messaging patterns (see patterns of enterprise architecture). Relationships would be modelled using an ORM style Relationship Manager so that you just specify what sort of relationships you want between two classes and its done. Furthermore, you can leverage SQL or LINQ style queries without having to write custom looping code etc.
There should be an integrated GUI builder that caters to various styles of application: web, form based with controls and menus, workspace based with draggable widgets and sprite based for game type approaches. A MVC framework would be built in so that you know where to put all your code and so that a proper separation between model and presentation is achieved. No more guessing - its all defined for you.
How can this sort of vision compete against the well funded and expensive MDA and Executable UML tools industry? I don’t know - my feeling is that MDA tools are stuck in a bit of a rut and aren’t taking advantage of more radical approaches that I have been talking about here. I have only scratched the surface and there is lots of detail to be worked out, I know. Its fun speculating about it anyway. I even have some screen designs if you wish to contact me about them!
Appendix: Links to various MDA tools
-
Dr Dobbs MDA tools list and commentary
-
Choosing MDA tools - IBM article
Comments
Posted by J. Alkub on Jan 18th, 2009
Debuggers are dynamic, automated ways of producing model-view-controller visualisations of your data, except they attach to ANY software application and reveal it, visually
Posted by Mike Davis on Feb 9th, 2009
Have you looked at ECO IV and V from CapableObjects? (www.capableobjects.com). Is is a UML modeler which uses an extension to OCL for triggered actions and state diagrams for object state models to generate syncronized C# and VB.NET (version V) only.
It really only builds the business layer and the data layer but integrates them quite seamlessly so that the developer can concentrate on the UI and Business Model alone…
mike
Posted by AndrewBoldman on Sep 22nd, 2009
Hi, good post. I have been wondering about this issue,so thanks for posting.
Posted by John Smythe on Sep 22nd, 2009
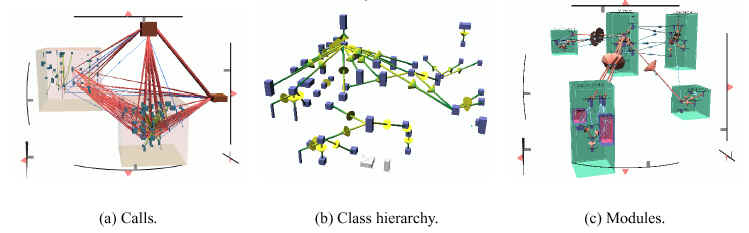
Check out xdepend - visualises dependencies in java programs
http://xdepend.com/
XDepend lets you extract, visualize, seek and control the structure of your applications and frameworks. XDepend provides complementary and interactive views on the same information. A Tree-Map view helps you easily identify the big one from the small one. The dependency matrix, the graph view and the detailed view help you gain insight in your code base.
Posted by K M Nur on Feb 11th, 2010
I am doing my masters thesis on software visualization / software comprehension and so far considered, bluej, jeliot3, jgrasp, javavis, jive, ville. I am looking for more tools for software visualization. Please inform me if you have any more ideas.
Regards,
KMN
Posted by Norm on Dec 29th, 2014
I’ll try to put this to good use immediately.