wxdiagram: a modern diagram canvas for wxPython
For a wxPython application, drawing a diagram has traditionally meant wx.lib.ogl. It is powerful and battle-tested, but it carries decades of accumulated ceremony — attachment models, metafiles, a double-buffered canvas you have to remember to blit — and on modern macOS it needed a 162-line monkeypatch just to draw shapes cleanly while dragging.
wxdiagram is the way out. It is a small, MIT-licensed shape-and-connector canvas for wxPython: shapes, attached edges, selection, zoom and pan, layout hooks, PNG export and JSON persistence. It has just been published to PyPI, and it is the canvas that now powers Pynsource, my Python UML tool.
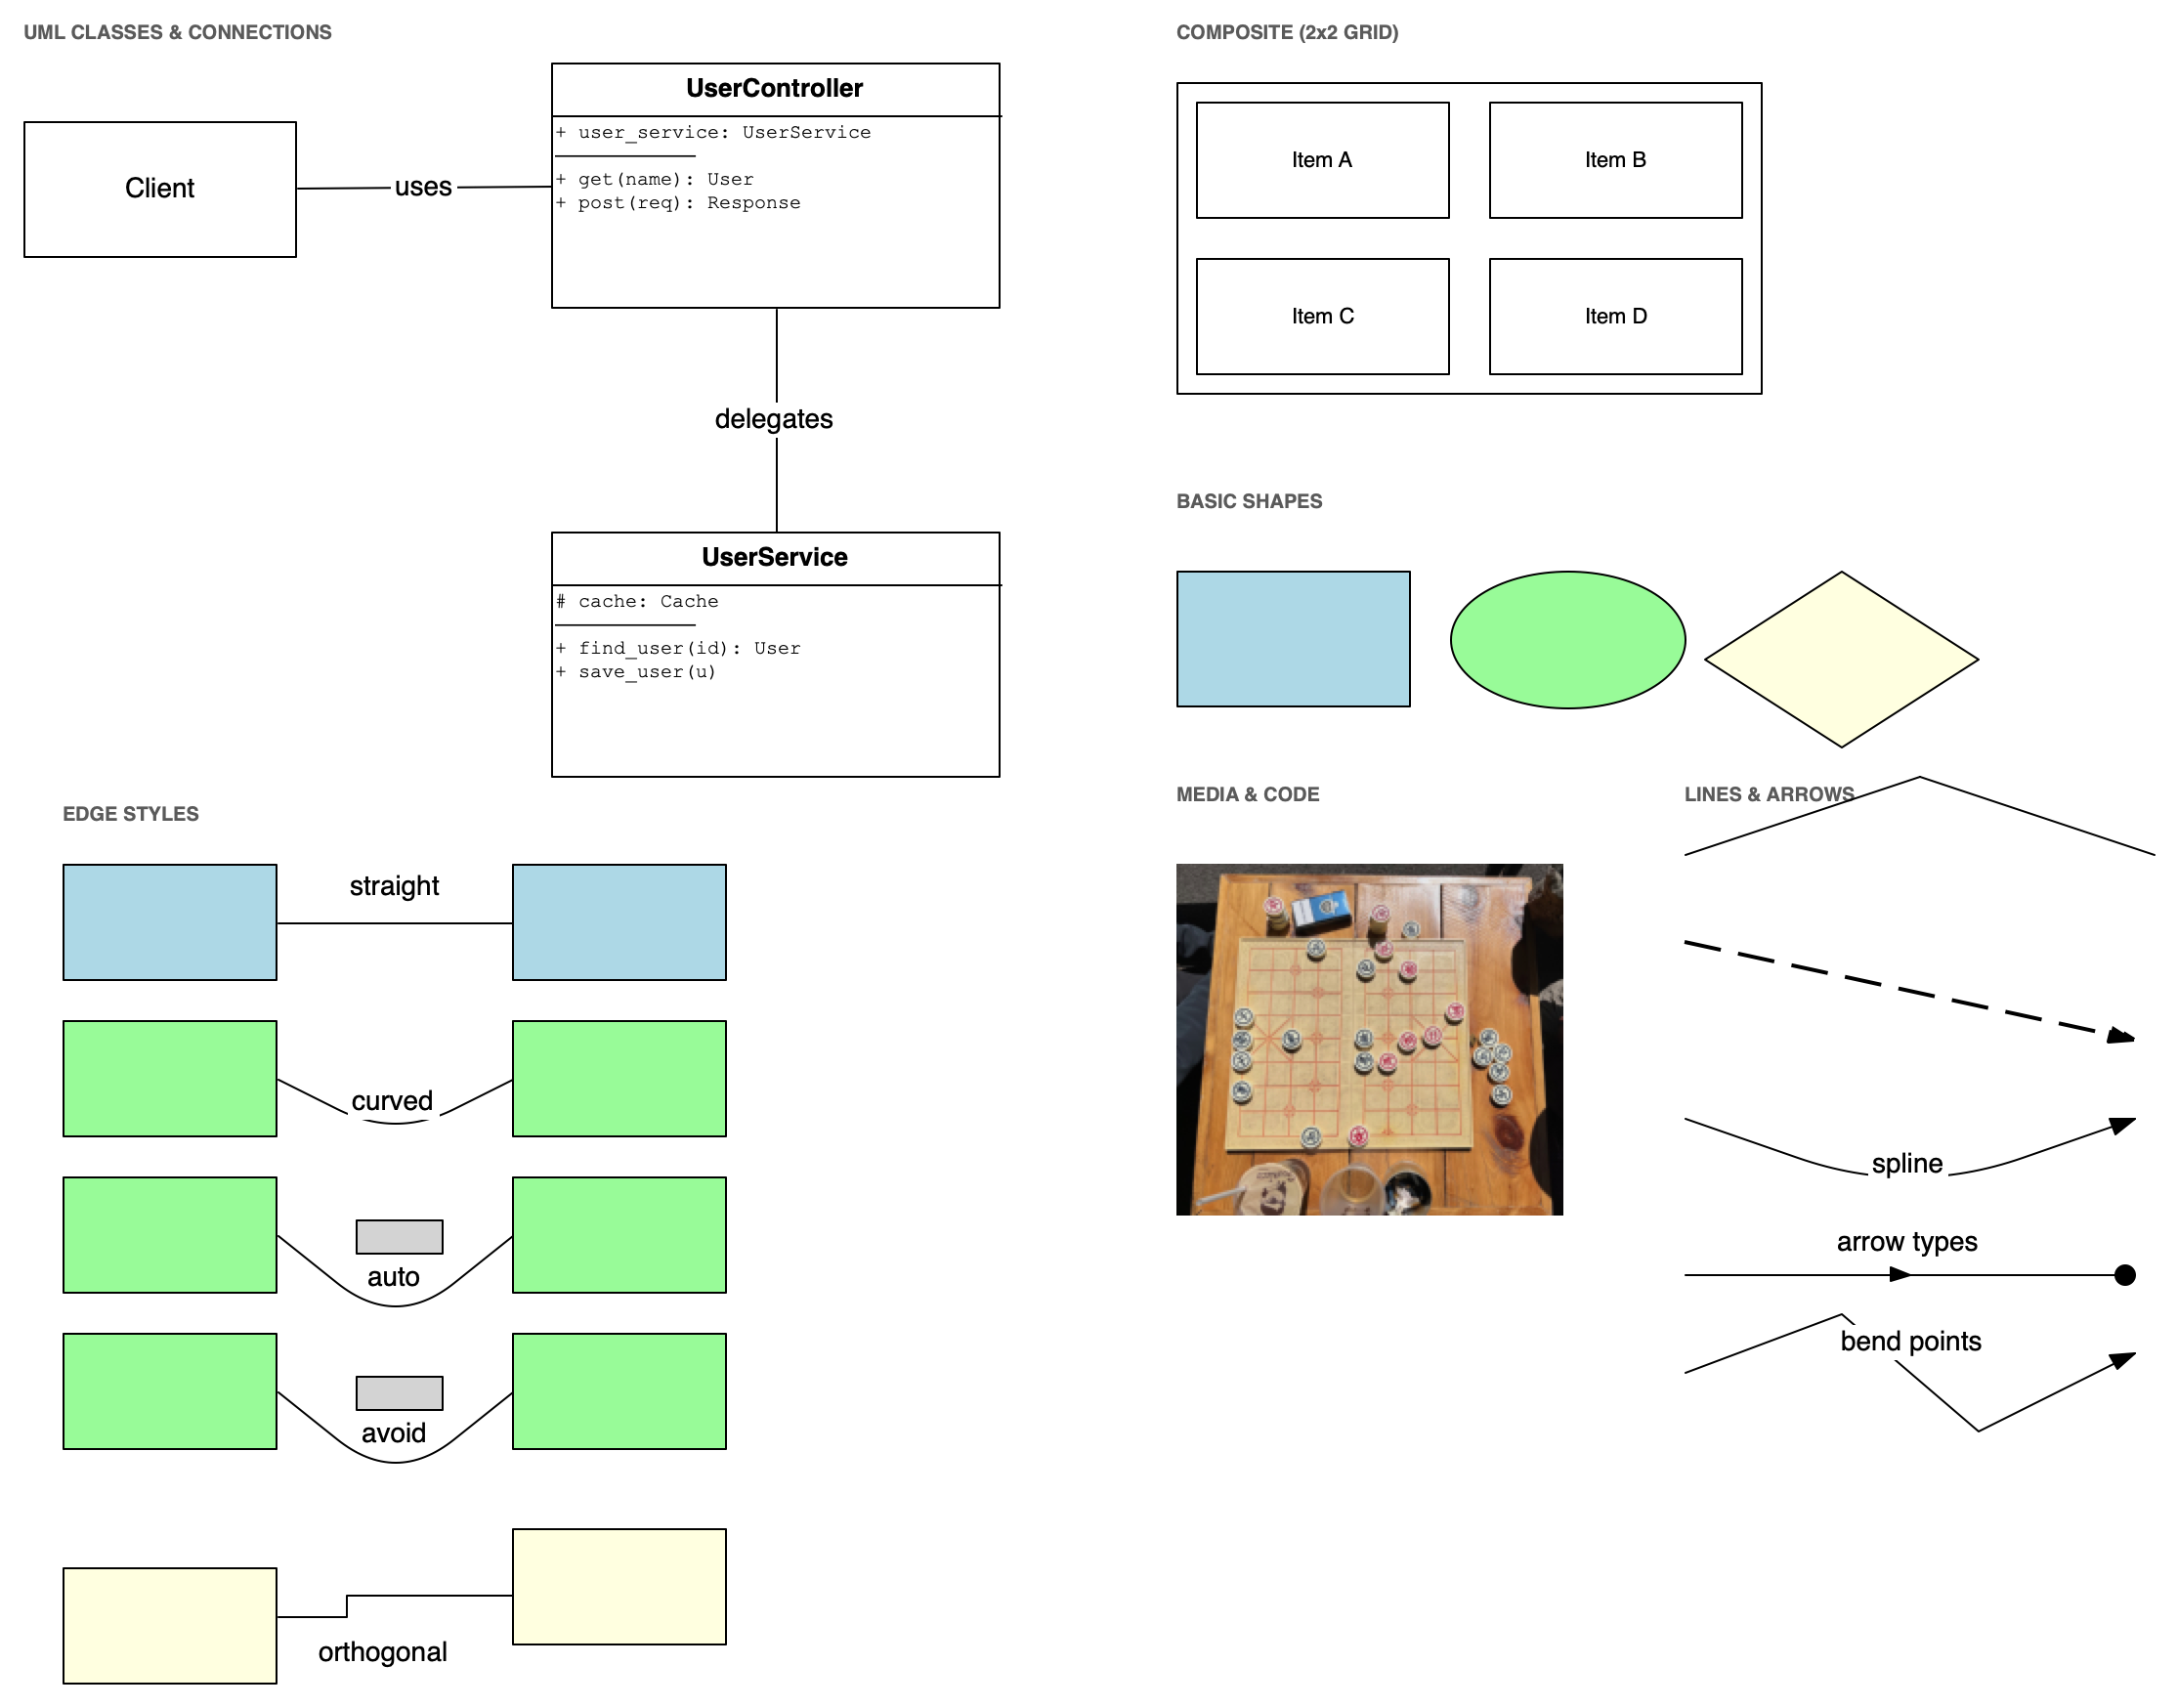
The kitchen-sink demo: UML-style class boxes, a composite, a basic-shape gallery, bitmaps, captions, edge styles and arrows — this is a canvas export.
A canvas, not a framework
The design decision that keeps wxdiagram small is that it stops at the canvas. It gives you a surface, shapes, edges and interaction. It does not give you a UML parser, a graph model, application menus, licensing or PlantUML integration. Those belong to the application above it.
That boundary is deliberate. A diagramming library that tries to own the whole application ends up with a huge surface area and a lot of opinions you have to work around. A canvas library can be dropped into a small tool or a large app and then extended in the direction the app actually needs.
The library is the ogl2 canvas from Pynsource, extracted and cleaned up. Pynsource is still its main downstream consumer, which means the API is exercised by a real, large application rather than by examples alone.
Start with a canvas
Requires Python 3.10+ and wxPython 4.2+:
pip install wxdiagram
The smallest useful app is genuinely small:
import wx
import wxdiagram

app = wx.App(redirect=False)
frame = wx.Frame(None, title="wxdiagram minimal", size=(600, 400))

canvas = wxdiagram.ShapeCanvas(frame)
canvas.SetDiagram(wxdiagram.Diagram())

shape = wxdiagram.RectangleShape(100, 100, 300, 200)
shape.AddText("hello world")
canvas.InsertShape(shape, 999)

frame.Show()
canvas.update_virtual_size()
app.MainLoop()
From there, the canvas handles the interaction you would otherwise write yourself: click to select, marquee-select, drag to move, resize from eight handles (Shift frees the aspect ratio, Alt resizes from the centre), arrow-key nudge, Delete, Ctrl+A, Ctrl+C/V, undo/redo and z-order. There is an optional grid with snap-to-grid and magnetic alignment guides to other shapes’ edges and centres.
Zoom and pan are built in rather than bolted on: ZoomToFit, ZoomTo, ZoomReset, CenterOn, Ctrl+wheel and macOS pinch zoom anchored at the pointer, and drag-to-pan on empty canvas. The scrollable area tracks the diagram, so panning cannot wander off into empty space.
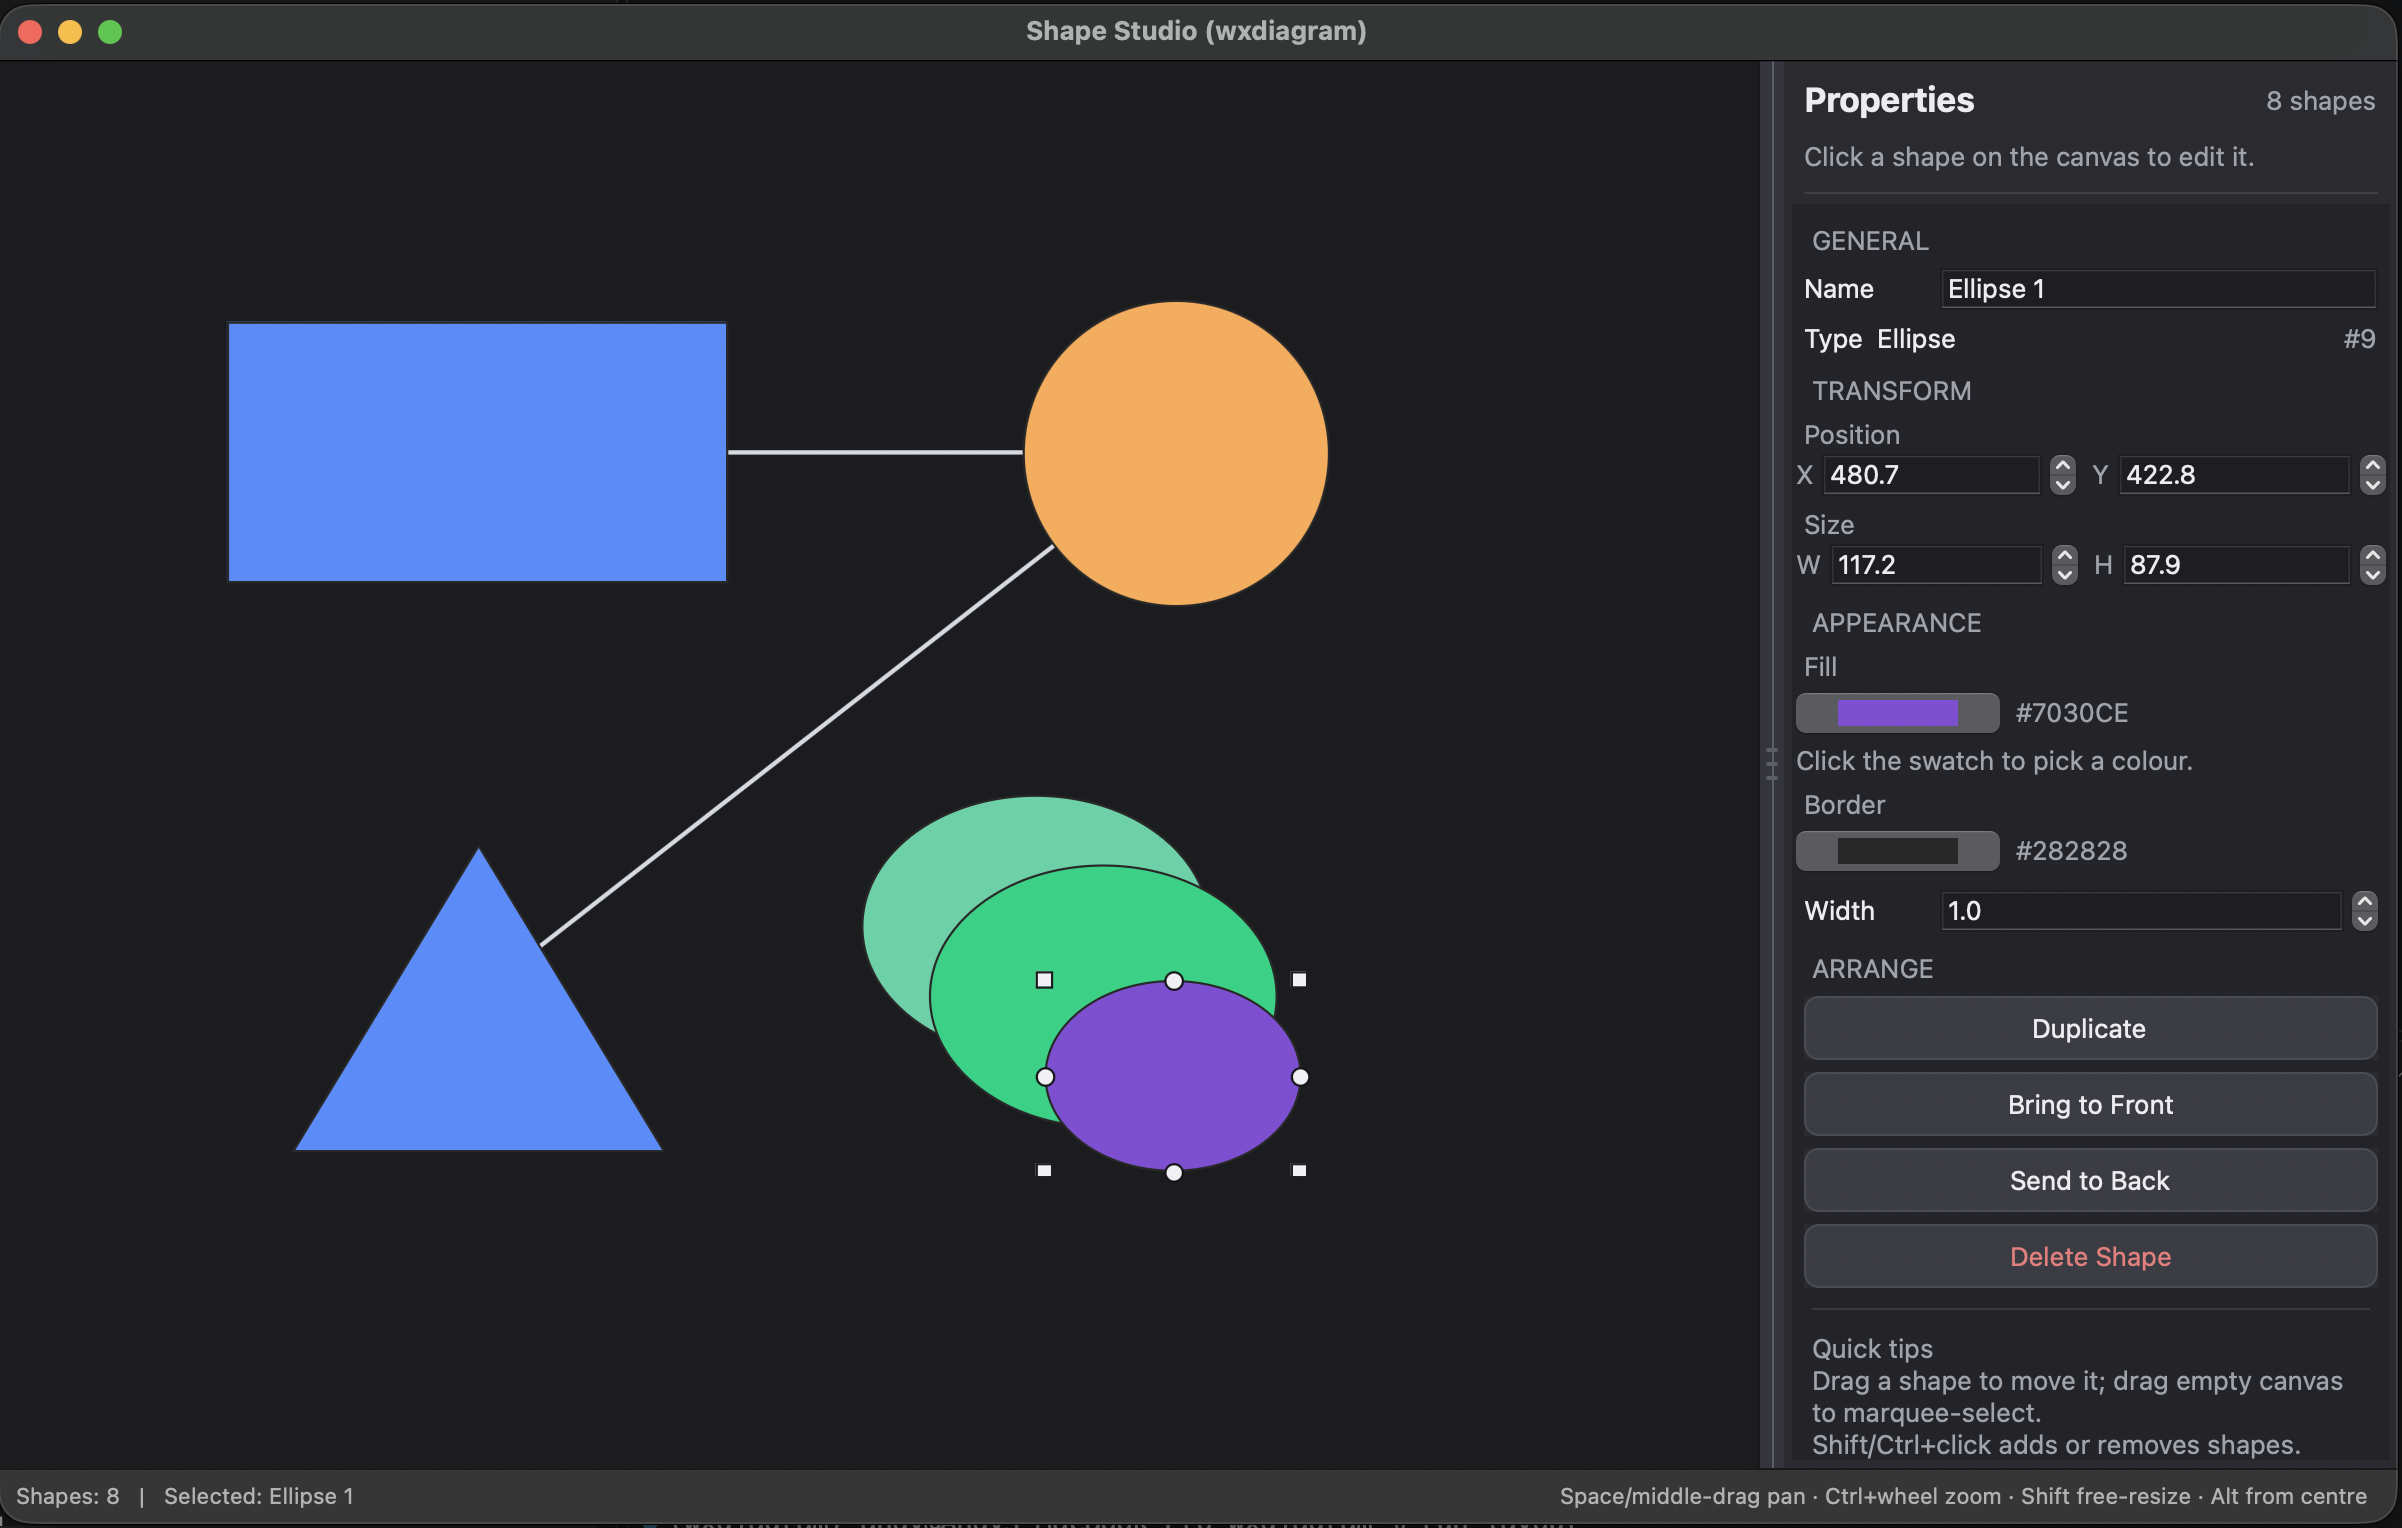
A Shape Studio-style editor built with the library: properties panel, shape tools, connection dots, grouping and light/dark themes.
Edges that stay attached
The feature that makes the canvas feel like a diagram tool rather than a drawing tool is attached edges. join_shapes connects two shapes, clips the line to their perimeters, and re-routes it when either shape moves:
line = canvas.join_shapes(source, target)
line.SetRouteMode("auto")          # straight, or curve around other boxes
line.AddArrow(
    wxdiagram.ARROW_ARROW,
    wxdiagram.ARROW_POSITION_END,
    size=12.0,
)
line.AddText("uses")
There are five routing modes:
| Mode | What it does |
|---|---|
straight |
an exact straight edge |
auto |
straight when clear, curved when a box blocks it |
avoid |
like auto, but may fall back to an orthogonal L/Z detour |
curved |
always a free curve |
orthogonal |
always an orthogonal route |
Edges also support arrowheads at the start, middle or end, splines, dashed pens, bend control points and editable labels. The label lives in the line’s regions, so it is saved with the diagram, and clicking it selects the edge.
Save, load, export
Diagrams save as versioned JSON with stable shape ids — no pickle, no object references:
diagram.Save("diagram.json")

loaded = wxdiagram.Diagram.Load("diagram.json")
canvas.SetDiagram(loaded)
canvas.ZoomToFit()
Labels, colours, route modes, bitmap filenames and composite children survive the round trip. For sharing a picture rather than a model, ExportPng renders the diagram at any scale, excluding selection handles and guides:
canvas.ExportPng("diagram.png", scale=2.0, margin=20)
The layout story
This is where wxdiagram goes somewhere wx.lib.ogl never went. OGL is a drawing and attachment library; it has no concept of laying out a graph. wxdiagram adds optional hooks:
- a deterministic spring layout (
ShapeCanvas.ApplyLayout) for graphs that need to be arranged automatically; - crossing-aware post-layout refinement (
reduce_crossings); - pluggable edge routers, with a per-edge or canvas-wide default and a batch
route_manyhook.
The layout is a protocol, not a cage. If you already have a layout algorithm — or want a layered, Sugiyama-style one later — you run it yourself and hand positions to the canvas. Experiments with router injection are deliberately not exposed in the demo UI yet.
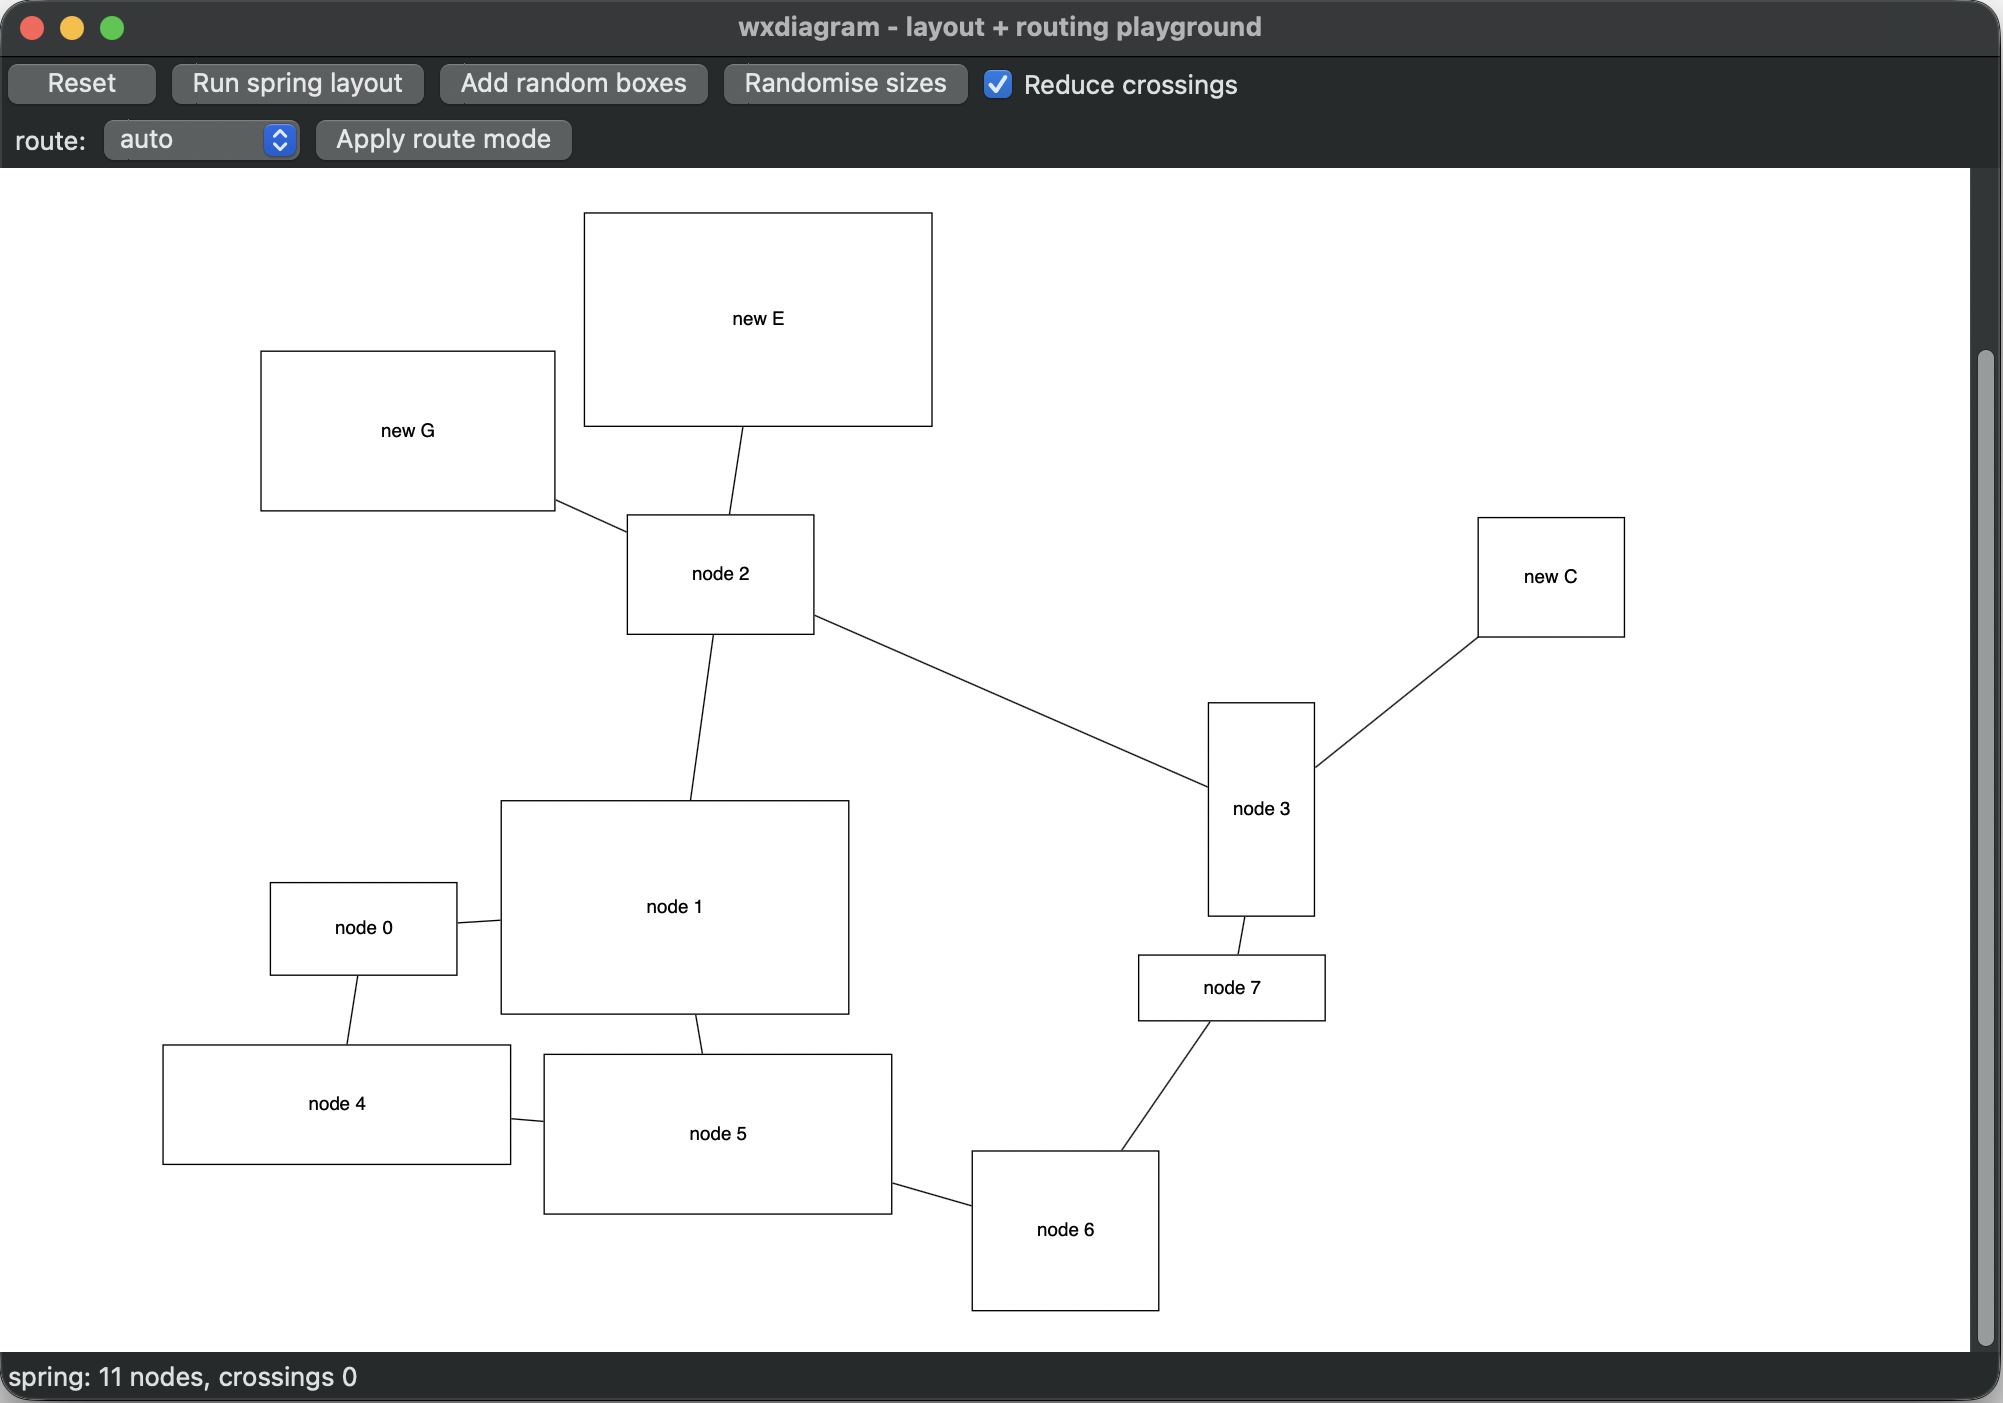
The layout playground: run the spring layout, randomise sizes, add nodes and switch route modes. The status bar reports crossing count.
That layout heritage is old, and it has its own story. Long before this library existed, Pynsource’s layout work produced a spring layout plus a hand-written overlap-removal pass, because academic layout algorithms tend to treat nodes as points and ignore the real width and height of a box. I wrote that up years ago in Developing a Layout Algorithm for UML diagrams — still worth reading if you have ever watched a “layout” pile all your classes on top of each other.
Where it came from
wxdiagram did not start as a library. It started as ogl2, a private fork of wx.lib.ogl inside Pynsource.
The original trigger was rendering. On modern macOS, wx.lib.ogl needed Pynsource’s 162-line repair_ogl.py monkeypatch to draw shapes correctly while dragging. Forking the library was the practical way to fix that, and once the fork existed it became the place to add the interaction features OGL had never had: proportional resize handles, marquee selection, grid and alignment guides, undo/redo, edge labels, route modes and viewport zoom/pan.
For seven years Pynsource ran the same GUI modules against both libraries, choosing at import time:
if PRO_EDITION:
    import ogl2 as ogl
else:
    import wx.lib.ogl as ogl
That dual-backend arrangement turned out to be an unintentional compatibility test suite. The application code — UmlCanvas, the DividedShape subclasses, LineShapeUml, UmlShapeHandler, the region formatting, the diagrams — had to work against both. When the fork was finally renamed and packaged as wxdiagram, switching Pynsource over was a one-line change:
import wxdiagram as ogl
The Pynsource proof
The interesting compatibility number is not how much of OGL’s entire API wxdiagram reproduces. It is how much of the API a real application actually calls. At version 0.2.7, Pynsource’s canvas code calls 53 names that OGL defines and that are present and working in both libraries — shapes, lines, regions, arrows, canvas, diagram and event-handler calls. Across the compared classes, 166 OGL-defined names are shared: 55% of wx.lib.ogl’s own surface and 74% of wxdiagram’s.
The actual port was seven seams, not a rewrite:
| Seam | What changed |
|---|---|
| Startup | OGLInitialize() → initialize() |
| Constructors | RectangleShape(w, h) → RectangleShape(x1, y1, x2, y2) |
| Position | centre-based SetX/SetY → move_to(left, top) / MoveTo(...) |
| Fonts | shape and regions hold fonts separately |
| Event handler | swap the base class to the mixin-style handler |
| Painting | paint directly in EVT_PAINT instead of blitting a back buffer |
| Zoom/pan | built into the canvas, so Pynsource’s PRO_EDITION guards went away |
And the original reason for the fork is gone too: no more repair_ogl.py.
The full detail, including call-equivalence tables and the OGL subsystems that were intentionally left behind, is in the migration guide.
What it deliberately is not
wxdiagram is a canvas library, not a UML framework. It has no parser, no application shell, no PlantUML integration and no complete wx.lib.ogl parity. It also does not pretend to be a full layout engine — the spring layout and routing hooks are there to be used and extended, not to replace a dedicated graph-layout project.
That is the useful shape for a library: small enough to understand, complete enough to build a real editor on, and honest about the boundary.
Try it
- Install:
pip install wxdiagram - PyPI: https://pypi.org/project/wxdiagram/
- Source: https://github.com/abulka/wxdiagram
- Docs: https://abulka.github.io/wxdiagram/
- Library page: wxdiagram
Three demos ship with the package — the kitchen sink, the shape editor and the layout playground:
uv run python -m wxdiagram.demo
uv run python -m wxdiagram.shapesdemo
uv run python -m wxdiagram.layoutdemo
It is beta (0.2.7), so pin a version if you depend on it. But if you have been putting off a wxPython diagram feature because wx.lib.ogl felt like a step back in time, this is the canvas I wish I had years ago.